Setup
Mac setup
...
- edit a javascript or jsp file: you should just be able to do reload page in the browser to get the changes. Sometimes you may need to also clear the cache.
- edit a java file: When you have changed a java file you will need to build before JRebel picks up on the changes. You'll find it under the Build -> Make Project menu. If you're using the default key bindings, it's CTRL-F9. If you're using Chris' settings (see Notes about IntelliJ IDEA) use Ctrl-M. Do reload page in the browser.
- edit a .properties file or add a directory: JRebel does not pick up on these types of changes properly. Do the Tomcat restart dance: Shutdown Tomcat, go to the command line, cd fluxtream-app, do 'mvn clean install', and restart Tomcat (see below). After that's done, login at http://localhost:8080/
cd $TOMCAT_HOME
./bin/shutdown.sh
cd ~/projects/fluxtream-app
mvn clean install
cd $TOMCAT_HOME
./bin/catalina-jrebel.sh jpda start - add/modify a connector: This includes both code changes and changes to connector pictures. Do the Tomcat restart dance as described above. Additionally, before logging into http://localhost:8080/ you will need to clear the Connector table in mysql:
 mysql -u root flx
 select * from Connector;
 delete from Connector;
...
Connector debugging
It helps to be able to use the admin console to be able to debug connectors. Here are the steps:
First, you need to make yourself an admin in your local flx DB. This assumes you're user ID 1; modify the 1 to some other number to affect a different user:
 mysql -u root flx
 select * from Guest;
 update Guest set roles = 'ROLE_USER,ROLE_ADMIN' where id=1;
In IntelliJ, open the Updater.java file specific to the connector you're debugging (example: FitBitTSUpdater.java for the Fitbit connector) and put a breakpoint in the updateDataHistory method.
If not already debugging, select 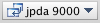 and click the debug start button:
 (see the Setup for debugging section of Notes about IntelliJ IDEA for how to set up to debug on jpda 9000).
Now go the the connector admin console at http://localhost:8080/admin/guests/1/connectors
Find the picture name of the connector you want to debug and click the  buttonthe button that looks something like this
  . The exact text will depend on the types of facets in use by that particular connector.
That should hopefully hit your breakpoint.